The pie-chart below shows the percentage of a family’s household income distributed into different categories.


The pie-chart below shows the percentage of a family’s household income distributed into different categories. Describe the pie-chart in 150 words.


The pie chart shows the percentage of a family’s household income distributed into some categories. These are food, clothes, education, power, transport, saving and others. According to the chart, the family’s highest expenditure is on food, and it is 25% of the total income. The lowest expenditure is on power which is 5%. However, the family spends 22% of its income for education, 13% for clothes. 12% for transport. Besides the above, the family spends 8% of its income in some other purposes which have been shown as ‘others’. After spending money in all these categories, the family saves some money, and this is 15% of the total income. From the graph, it is clear that the family’s total expenditure is 85% of its income, and the savings is 15%. If we make a list of the categories of expenditure from the highest to the lowest we find this serial: Food, education, clothes, transport, others, and power.


The graph below shows "The Internet Users ".


The graph below shows “The Internet Users” from 2000 to 2009. Describe the graph in 150 words. You should highlight and summarize the information given in the graph.


The graph shows the number of people using the internet from the year 2000 to 2009. The graph, at a glance, shows a tremendous rise of internet users over the years. In 2000, only 0.003 lakh people used the internet. In 2002, this rises to 1.5 lakh which means that in two years’ time 1.497 lakh more people began to use the internet. This trend of growth accelerates further in next years. We find that in 2003, 2.43 lakh people used the internet. After two years, that is in 2005, it becomes 3.00 lakh. Again, if we study the graph we find that the number of people using the internet increases faster between 2005 and 2007. In 2005 the users were 3.00 lakh while it rises to 5.00 lakh in 2007, which means that in two years’ time 2.00 lakh more people began to use ‘internet. However, there is a little increase between 2007 and 2008. In 2007 it was only 5.00 and in 2008, it rises to 5.56 lakh, that is, a growth of only 0.56 lakh. But from 2008, again the trend of growth goes faster. We find that between 2008 and 2009, there is an increase of 0.61 (6.17-5.56) lakh users. According to the graph we can say, that within a span of nine years the users of interne rise from 0.003 lakh to 6.17 lakh which is really a very significant growth of the users of interne over time.


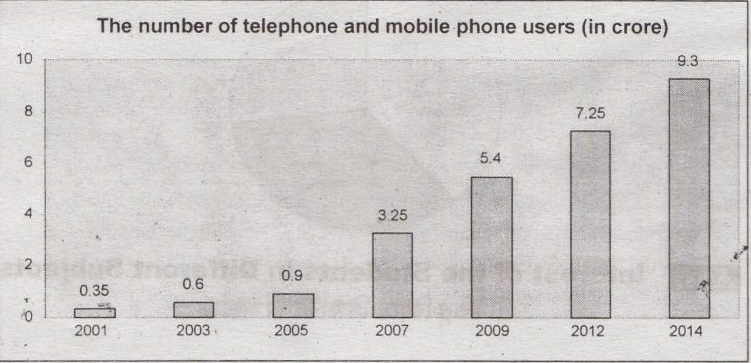
The graph below shows 'The number of Telephone and Mobile Users'.


The graph below shows ‘The number of Telephone and Mobile Users‘ from 2001 to 2014. Describe the graph in 150 words. You should highlight and summarize the information given in the graph.


The graph shows the number of telephone and mobile users from the year 2001 to 2014. At a glance, the graph shows that there has been a significant increasing trend of phone users over time. It is seen that in 2001, only 0.35 crore people used telephone and mobile phone. Two years later, that is, in 2003, the users increase to 0.60 crores. We notice a further increase in 2005 when the users turned to 0.90 crores. The increasing trend continues in later years. Thus in 2007, the users are 3.25 crore, in 2009 the users are 5.40 crore, in 2012 they are 7.25 crore, in 2014 they are 9.30 crore. The growth trend over the period is 0.25 crore, 0.30 crore, 2.35 crore, 2.15 crore, 1.85 crores, 2.05 crore. It is found that the highest growth (2.35) occurs between 2005 and 2007 and the lowest growth (0.25) occurs between 2001 and 2003. Thus, the graph shows a clear idea about the increasing trend of telephone and mobile users from the year 2001 to 2014.


The pie chart below shows the interest of the students of a secondary school in different subjects.


The pie chart below shows the interest of the students of a secondary school in different subjects. Describe the chart in about 150 words. You should highlight and summarize the information given in the chart.


The pie chart shows the interest of students of a secondary school in different subjects. These subjects are Mathematics, Science, English, and Bengali. The percentage of students like these subjects respectively are 35%, 27%, 17%, and 21%. Thus the graph at a glance shows that the highest number of students have interest in Mathematics, and this is 35%. The lowest number of students like English and their percentage is 17. Science is liked by 27% students, and Bengali is liked by 21% students. In order of interest from higher to lower the subjects are Mathematics, Science, Bengali, and English. It is clear from the chart that the student of this secondary school has more interest in Science subjects and less interest in language subjects. The least interest is found in English.


The graph below shows the number of mobile phone users in Bangladesh.


The graph below shows the number of mobile phone users in Bangladesh. Describe the graph in 150 words. You should highlight and summarise the information given in the graph.


The graph shows the number of mobile phone user in Bangladesh between the years 2008 and 2012. At a glance, the graph shows that the number of mobile phone users has increased very remarkably in a span of four years. According to the graph, only 30% of people used a mobile phone in 2008. The percentage increases gradually exception in 2011. In 2012 the number of users turns 88%. However, the increases do not occur equally in each year. Only 5% increase occurs in 2009. But next year, that is in 2010, 38% (73%-35%) increases occurs. But In 2011 2% decrease occurs. In 2012 there occur moderately higher increases. This year 17% (88%-71%) increases taken place. Thus we can say that there is a higher trend of increase of the mobile phone users from the year 2008 to 2012 except in 2011. The very remarkable increase occurs between 2009 and 2010 and between 2011 and 2012.


The graph below shows the percentage of the number of internet users in towns and villages.


The graph below shows the percentage of the number of internet users in towns and villages from 2010 to 2014. Describe the graph in about 150 words. You should highlight and summarize the information given in the graph.


The graph shows the percentage of the number of internet users in towns and villages from 2010 to 2014. The graph, at a glance, shows that he has been a steady growth of internet users both in towns and villages. In towns, the percentage of internet users was only 10 in the year 2010. This rose to 15% in 2011, 20% in 2012, 27% in 2013 and 40% in 2014. So, over the period of only four years, the percentage jumped from 10 to 40. The highest rise (13%) is noticeable in the year 2014. Again, if we look at villages we notice that the percentage of internet users was only 3 in the year 2010. This rises to 5% in 2011, 8% in 2012, 10% in 2013 and 15% in 2014. So in villages, the users of internet jumped from 3% to 15% in a span of four years. Again we can calculate that in villages the rise in 2011 is’2%, in 2012 it is 3%, in 2013 it is 2% and in 2014 it is 5%. In towns the rise is calculated as 5% in 2011, again 5% in 2012, 7% in 2013 and 13% in 2014. Therefore, if we compare the towns and villages we notice that the percentage of internet users rises much faster in towns than in villages.


The graph shows Ekushey Boi Mela Book Sales.


Look at the following graph. It shows comparative selling rates—Of four types of books in Ekushey Boi Mela, 2018. Now describe the graph in 150 words.


The graph shows a comparative selling rate of the four types of books in Ekushey Boi Mela 2013. These four types of books are Science Fictions, Novels, History, and Poetry. Of these four types of books the Novels were sold higher than any other type and its number is about 4200. The second highest in selling is the Science Fictions, the number of which is 3000. The third position in selling is History and its number is 2200. The lowest in the sale is the poetry books. Its number is about 600. Analyzing the graph we can say that out of the sold 10,000 books the number of Novels is 4200, Science fiction is 3000, History is 2200 and Poetry is 600. Therefore if we make a list of the categories of books from the highest selling rate to the lowest then we find this serial: Novel, Science Fiction, History, and Poetry. At a glance, the graph shows that Novels occupy the highest position in selling rate and Poetry has the lowest position. The other two types of books History and Science Fiction remain in between. Thus the graph gives a very clear picture of the four types of books sold in the Ekushey Boi Mela 2018.